What is the permgen
The Permanent Generation (PermGen) Heap is a heap in the JVM dedicated to storing the JVM’s internal representation of Java Classes (and also interned String instances). Usually, this heap is of a fixed size in the JVM and if it runs out of space then an OutOfMemory exception is thrown even if there is space available in the other heaps.
Every Java Object holds a reference to its own java.lang.Class object and every java.lang.Class in turn holds a reference to the class loader that instantiated it. Each class loader holds a reference to every class that it has instantiated which can potentially be a very large number.
If an object instantiated by one class loader holds a reference to an object in another class loader, then the latter object cannot be garbage collected until that reference is given up, which means its class object cannot be garbage collected, which means its class loader cannot be garbage collected, which means none of the classes instantiated by that class loader can be garbage collected.
Web application containers
This sort of a permgen memory leak is in fact a common issue with web application containers such as Tomcat/JBoss because the way they work is that every web application gets its own class loader instance (so as to prevent one application from interfering with another). However, the container itself is a java application and thus has a boot class loader that is responsible for loading all the JRE classes. If an application were to register a class instance under the boot class loader and then never clean it up, this would result in an application class loader memory leak on application re-deploy.
We recently ran into such a problem where our JBoss container running on the TeamCity agents started crashing with a permgen out of memory exception.
Finding the memory leak
We were lucky enough to have a heap dump of the crashed java application so we were able to use the Eclipse Memory Analyser Tool (MAT) to analyse the dump. The following are the steps we took to discover the leak and it's source.
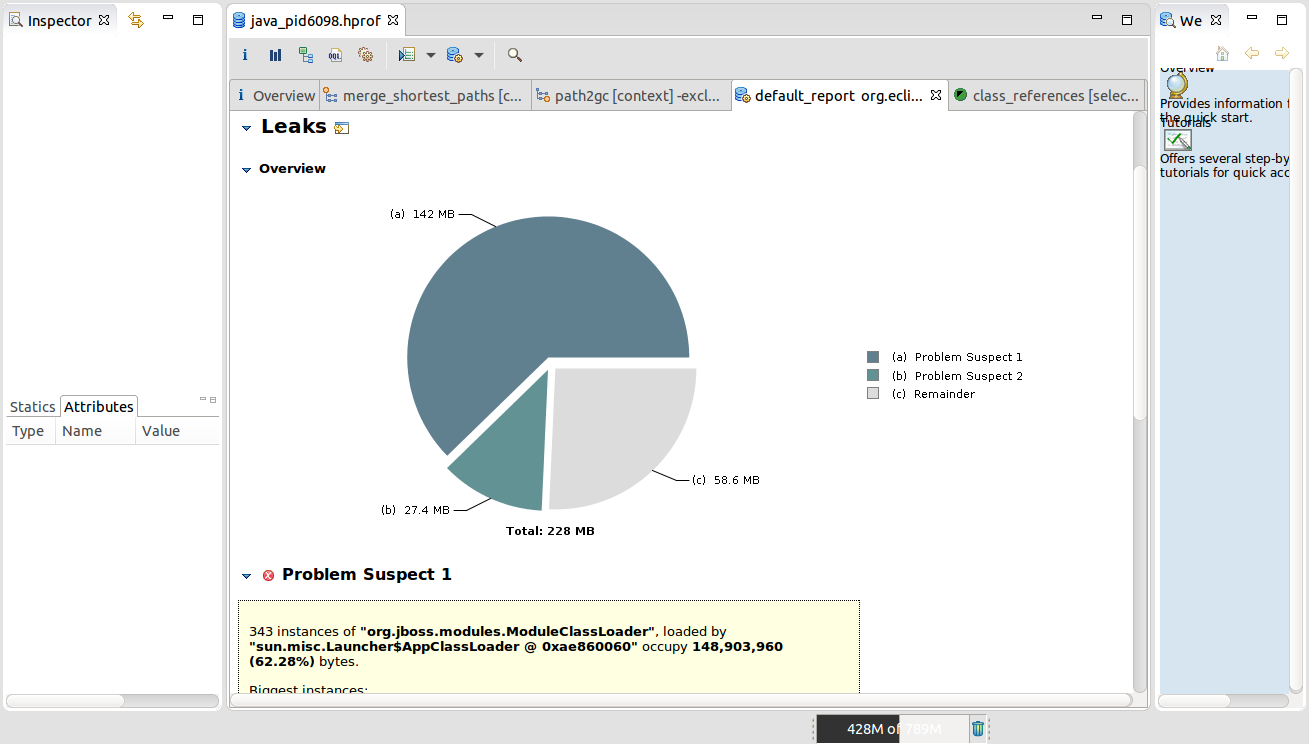
Load the heap dump and ran the leak suspects report which showed 343 instances of org.jboss.modules.ModuleClassLoader each being ~9.2 Mb in size. This confirmed that our problem is an errant reference from the JVM boot class loader to one or more of the classes in the application class loader.
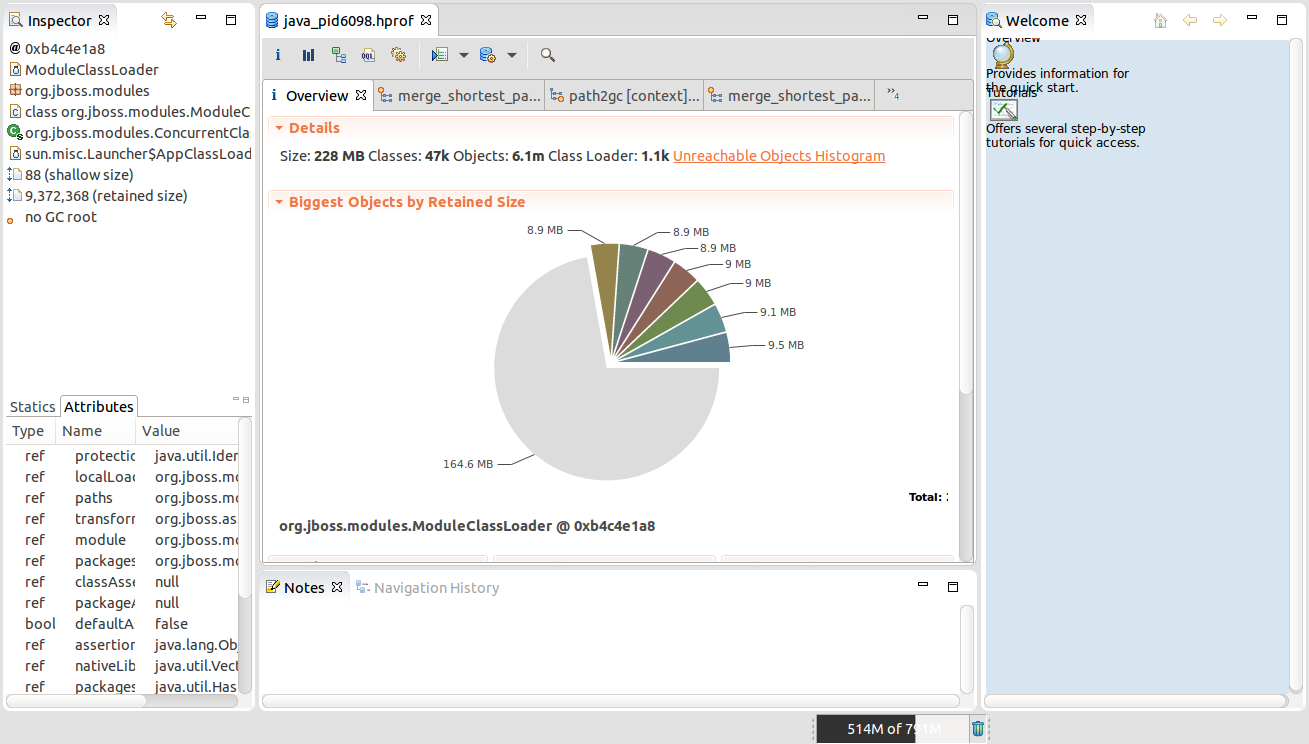
We then clicked back to the overview tab and then clicked on one of the ModuleClassLoader instances, then selected the Merge Shortest paths to GC roots menu option and then finally exclude weak references to discover who is holding a reference to this instance.
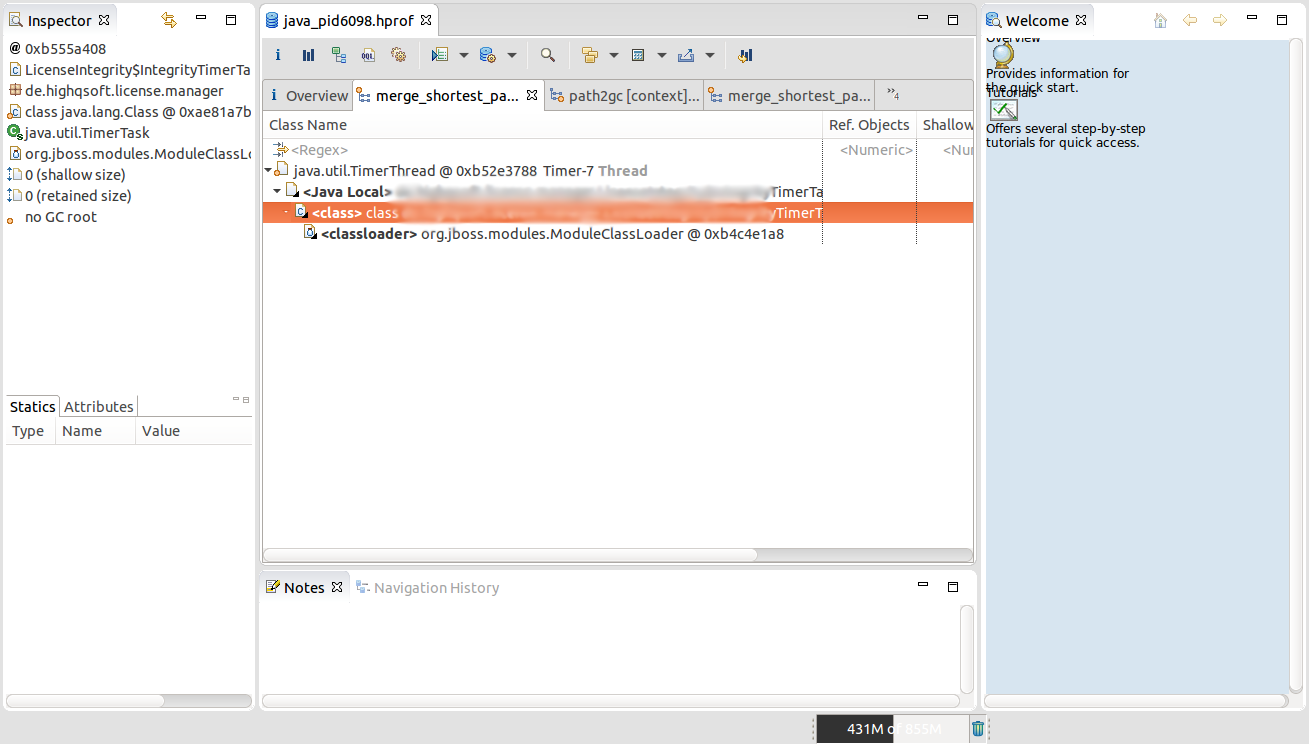
We observe here that a Timer thread is holding a reference to an instance of ...TimerTask which is then holding a reference to the ModuleClassLoader. This means that everytime we redeploy the application, we create a memory leak as this timer thread is not killed and therefore the old application cannot be garbage collected.
Further source code investigation led to the confirmation of this behaviour as this instance was being run a as a scheduled task in a daemon thread.
References & Misc
Steps to use visualvm to profile memory for a standalone JBoss application:
- Allow visualvm to use 1024 Mb of RAM - in
etc/visualvm.confupdate-Xmxparameter to-J-Xmx1024m - Need to add the following jvm option in Jboss to enable profiling via visualvm:
"-Djboss.modules.system.pkgs=org.netbeans.lib.profiler.server". For example, Line 155 instandalone.sh:JAVA_OPTS="$PREPEND_JAVA_OPTS $JAVA_OPTS -Djboss.modules.system.pkgs=org.netbeans.lib.profiler.server"
The following resources were incredibly useful in helping to track down the problem and find a solution:
- An excellent tutorial on analysing memory leaks in the heap using visualvm
- An excellent primer on analysing memory leaks in java - also shows how to produce memory dumps.
- Tomcat wiki with examples of memory leaks